


Summary
ISRO'S Web-Based automatic identification of Solar Bursts in X-Ray Light Curves
Cosmic sources in the sky, including our star, the Sun, burst intermittently in the X-ray energy band of the electromagnetic spectrum. The burst amplitude and the duration vary depending on the source and the cause of the burst. The observed burst has a fast rise and slow decay pattern/shape with variable rise and decay times. An automatic identification system for such data will further simplify the analysis process and the associated scientific investigation of these bursts.
Problem Statement
Design and build a stand-alone web-based application using open-source software(s) to identify and categorize X-ray bursts. Given data will include long-duration X-ray light curves as well. Parameters like the rise and decay time, peak flux, duration of bursts, etc., must be derived. False detection should be minimum, and all bursts must be detected
My Role
I was asked to understand the vision and working of the application and conduct appropriate user study to come up with the visual language and design the screens. I had to also deliver an appropriate UI to display the data in a manner in which it can be interpreted easily.
Duration
5 Days
Client
Inter IIT Tech Meet, in its 10th edition, invited over Indian Space Research Organisation (ISRO). They presented the challenge of analyzing Design and build Web-Based automatic identification of Solar Bursts in X-Ray Light Curves. The data collected through Chandrayaan 2 was provided.

Secondary Research
What are solar burst’s?
Solar flares are significant eruptions of electromagnetic radiation from the Sun lasting from minutes to hours. The sudden outburst of electromagnetic energy travels at the speed of light. Therefore any effect upon the sunlit side of Earth's exposed outer atmosphere occurs simultaneously the event is observed.
About the data
A light curve measures a celestial body's brightness at certain intervals and over a given period. In the problem statement, we have been given long duration light curves of various X-Ray sources, and we need to detect and categorise the solar bursts. The burst amplitude and the duration vary depending on the head and the cause of the burst. The observed burst has a fast rise and slow decay pattern/shape with the variable rise and decay times.
Primary Research

Current UI

The Issues
The Opportunities
Define
Brainstorming
We ideated how we can develop an end-to-end solution that enables a user to interpret data easily with the help of an intuitive UI; we classified our ideas in the following ways.
Updated Process

The Process
After research and understanding the ML team started working on the model to get every bit out of the data the following diagram shows the sophisticated model created by ML Team.
My job was to make sure data is processed in such a way that it can be filtered and interpreted in the easiest way possible.


Design
Screens
Homepage
The screen that welcomes the user.

Input
The screen where user can upload the data to be processed.

Output
This screen shows the visualisation of the processed data. The user can also filter the data as per his needs.
Design
User flow
These structures highlight critical points in user journey and flows of the portal and break down process the user would use to achieve the task.

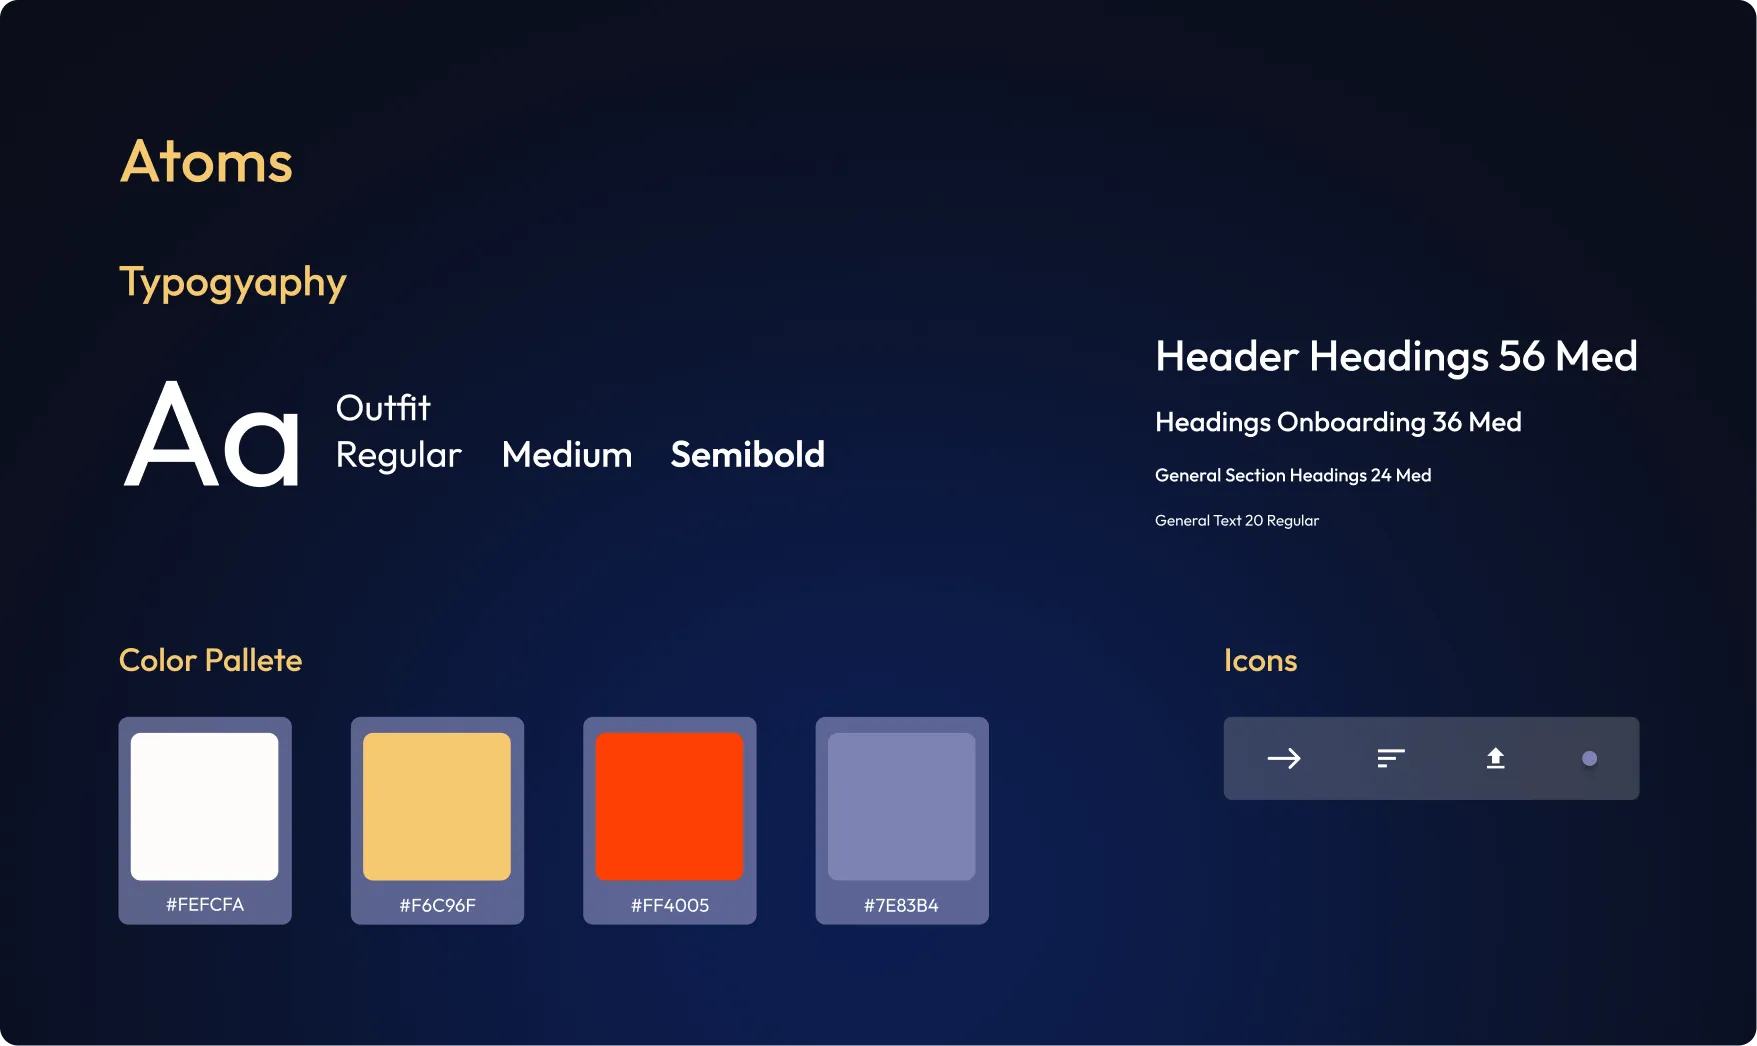
Atomic Design System
Delivery
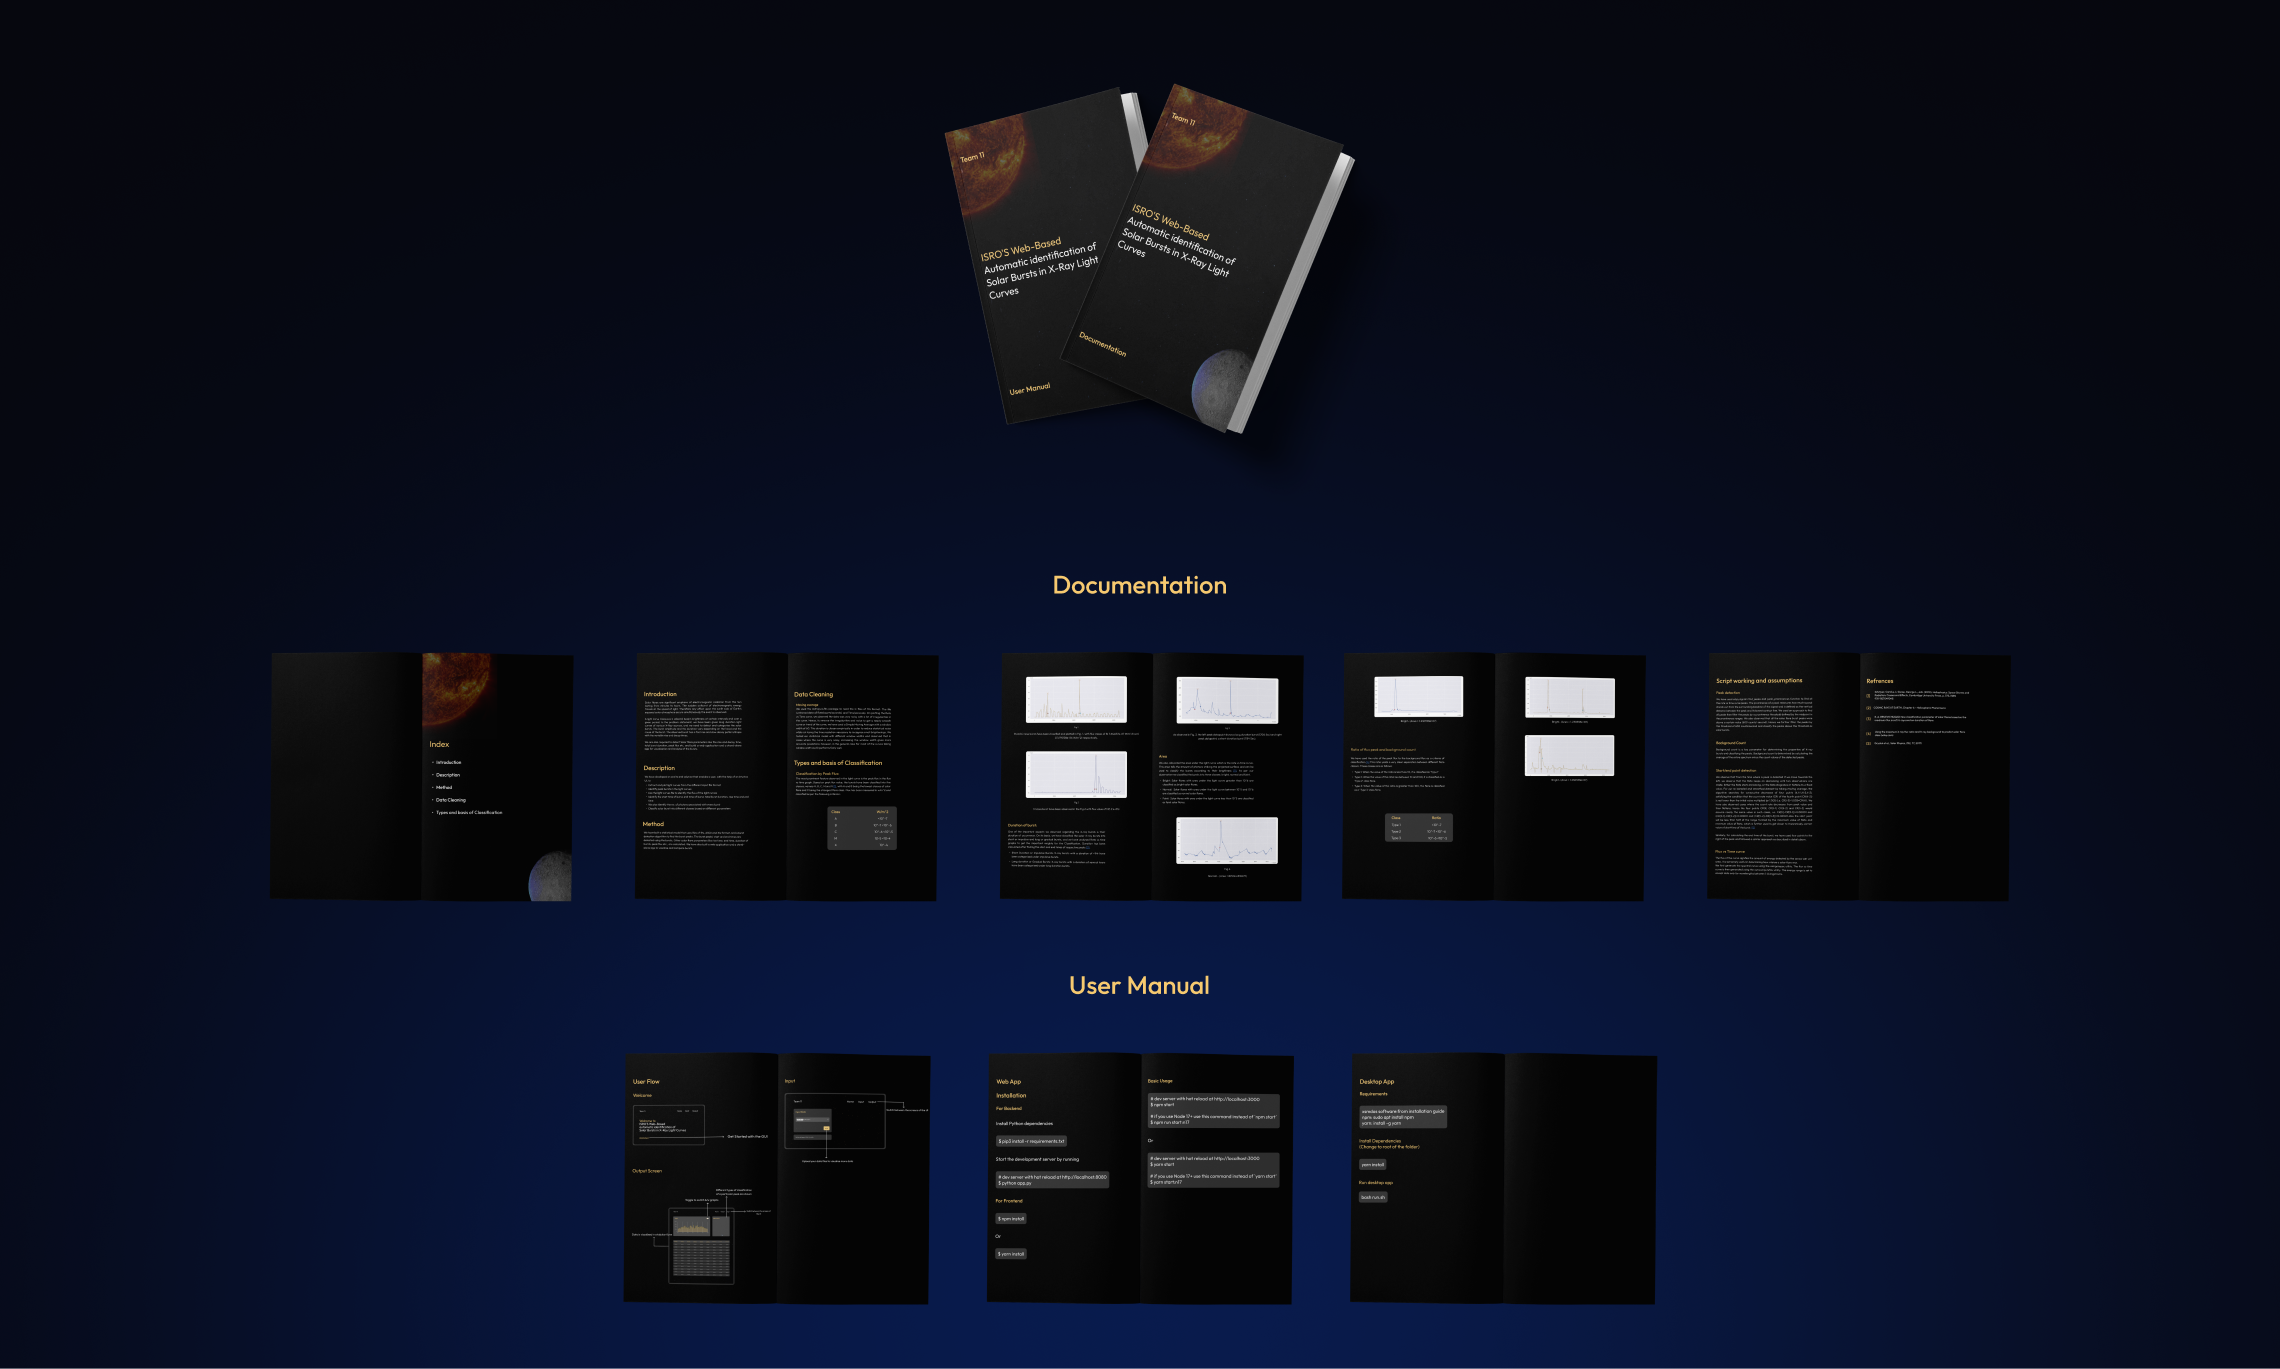
Documentation
A complete guide to the process of the interface with step-by-step instructions was provided to access the portal and know how things work.
Presentation
We presented our work to the isro following image shows some visuals of the same along with the presentation delivered.


